Abstract
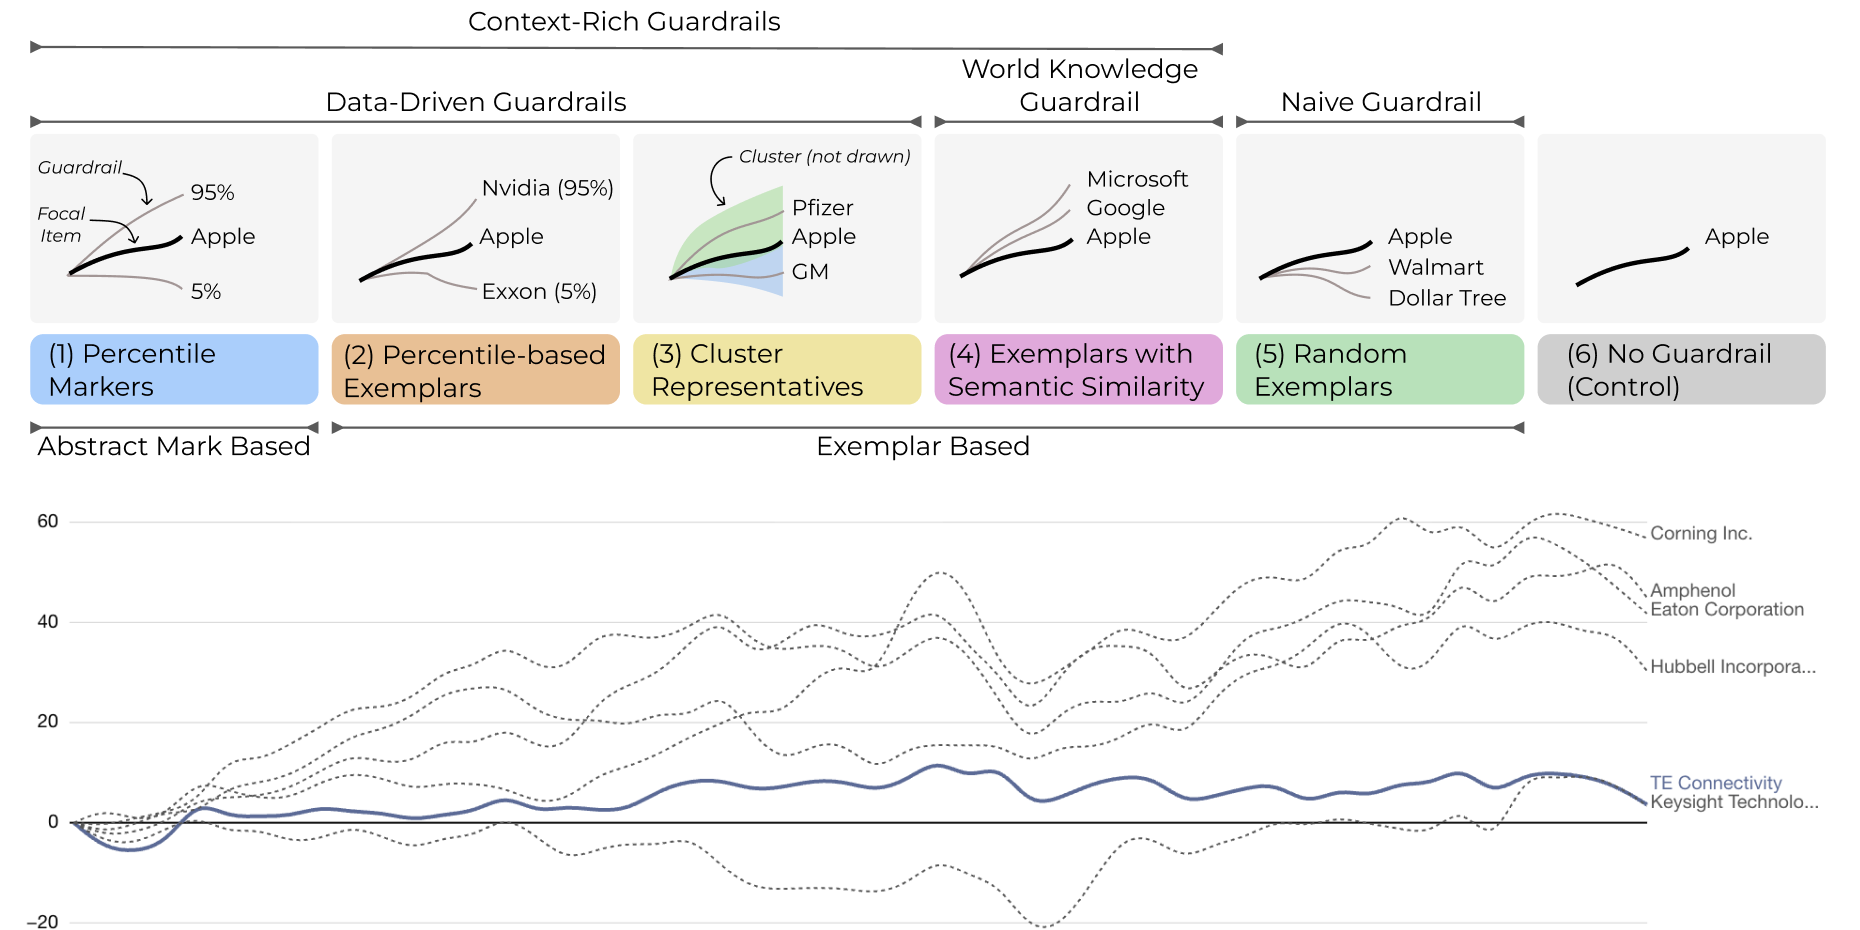
Charts used for persuasion can easily veer into being outright misleading when, for instance, cherry-picked data is paired with a deceptive caption, as is commonly encountered on social media. The rise of interactive time-series data explorers for hotly debated topics makes such framing easy to produce and spread. Post-hoc interventions like fact-checking often arrive too late and suffer from persistence of belief. Prior work suggests that guardrails, in the form of contextual comparison lines embedded directly into charts, can reduce these effects. We propose and evaluate a practical set of guardrail sampling strategies for implementing such contextual lines in real systems. In a preregistered mixed-design study with two real-world scenarios (COVID-19 and Stocks), participants viewed persuasive charts with different sets of guardrails and reported trust, estimated rank in the dataset, expressed their perceived completeness of context, as well as subjective preference for different tasks. Across scenarios, guardrails improved trust, accuracy of performance judgments, and perceived completeness of context compared to the control. Taken together, the study offers practical guardrail sampling methods, evidence of their contextual benefits, and insights into participants' preferences.Citation
Khandaker Abrar Nadib,
Marina Kogan,
Alexander Lex,
Maxim Lisnic
Guardrail Selection in Line Charts to Contextualize Persuasive Visualizations
Computer Graphics Forum (EuroVis), 45(3): e70460, doi:10.1111/cgf.70460, 2026.
BibTeX
@article{2026_eurovis_guardrail-selection,
  title = {Guardrail Selection in Line Charts to Contextualize Persuasive Visualizations},
  author = {Khandaker Abrar Nadib and Marina Kogan and Alexander Lex and Maxim Lisnic},
  journal = {Computer Graphics Forum (EuroVis)},
  doi = {10.1111/cgf.70460},
  volume = {45},
  number = {3},
  pages = {e70460},
  year = {2026}
}
Acknowledgements
This work is supported by the National Science Foundation (CNS 2213756).