Publications
Peer-reviewed Journal and Conference Publications
Zach Cutler,
Jack Wilburn,
Hilson Shrestha,
Yiren Ding,
Brian Bollen,
Khandaker Abrar Nadib,
Tingying He,
Andrew McNutt,
Lane Harrison,
Alexander Lex
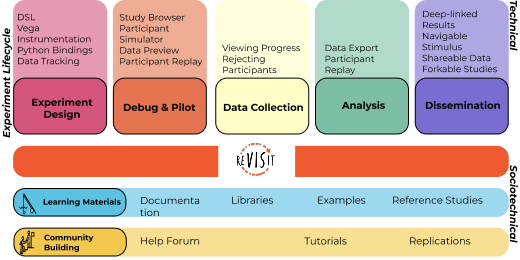
ReVISit 2: A Full Experiment Life Cycle User Study Framework
IEEE Transactions on Visualization and Computer Graphics (VIS), 2026
IEEE VIS 2025 Best Paper Award
Commentary
Thesis
Selected Posters
Funded Research Projects
Talks
Keynote Talks
Also see the related blog post.
Abstract: Over the last 15 years, I have been involved in numerous projects that aimed to build visualization research software – not just as demonstrations for papers, but as systems that could be sustained, adopted, and used beyond their original research context. Some of these efforts failed; others achieved tentative forms of success.
In this talk, I will reflect on what worked, what did not, and what I learned from both. I will discuss different ways visualization research software can succeed: by advancing an idea even when the lasting contribution is not the artifact, by turning a prototype into a commercial product, or by growing a project into community-focused open-source infrastructure. Drawing on these experiences, I will offer practical guidelines for researchers who want to build software that survives beyond the initial publication.
VisGap Workshop at EuroVis 2026, Nottingham, UK, 2026-06-08.
ICG Lab Talk Series at Institute of Computer Graphics, JKU Linz, Austria, 2026-06-23 (invited talk).
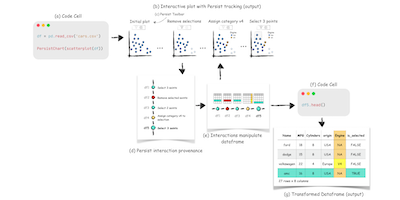
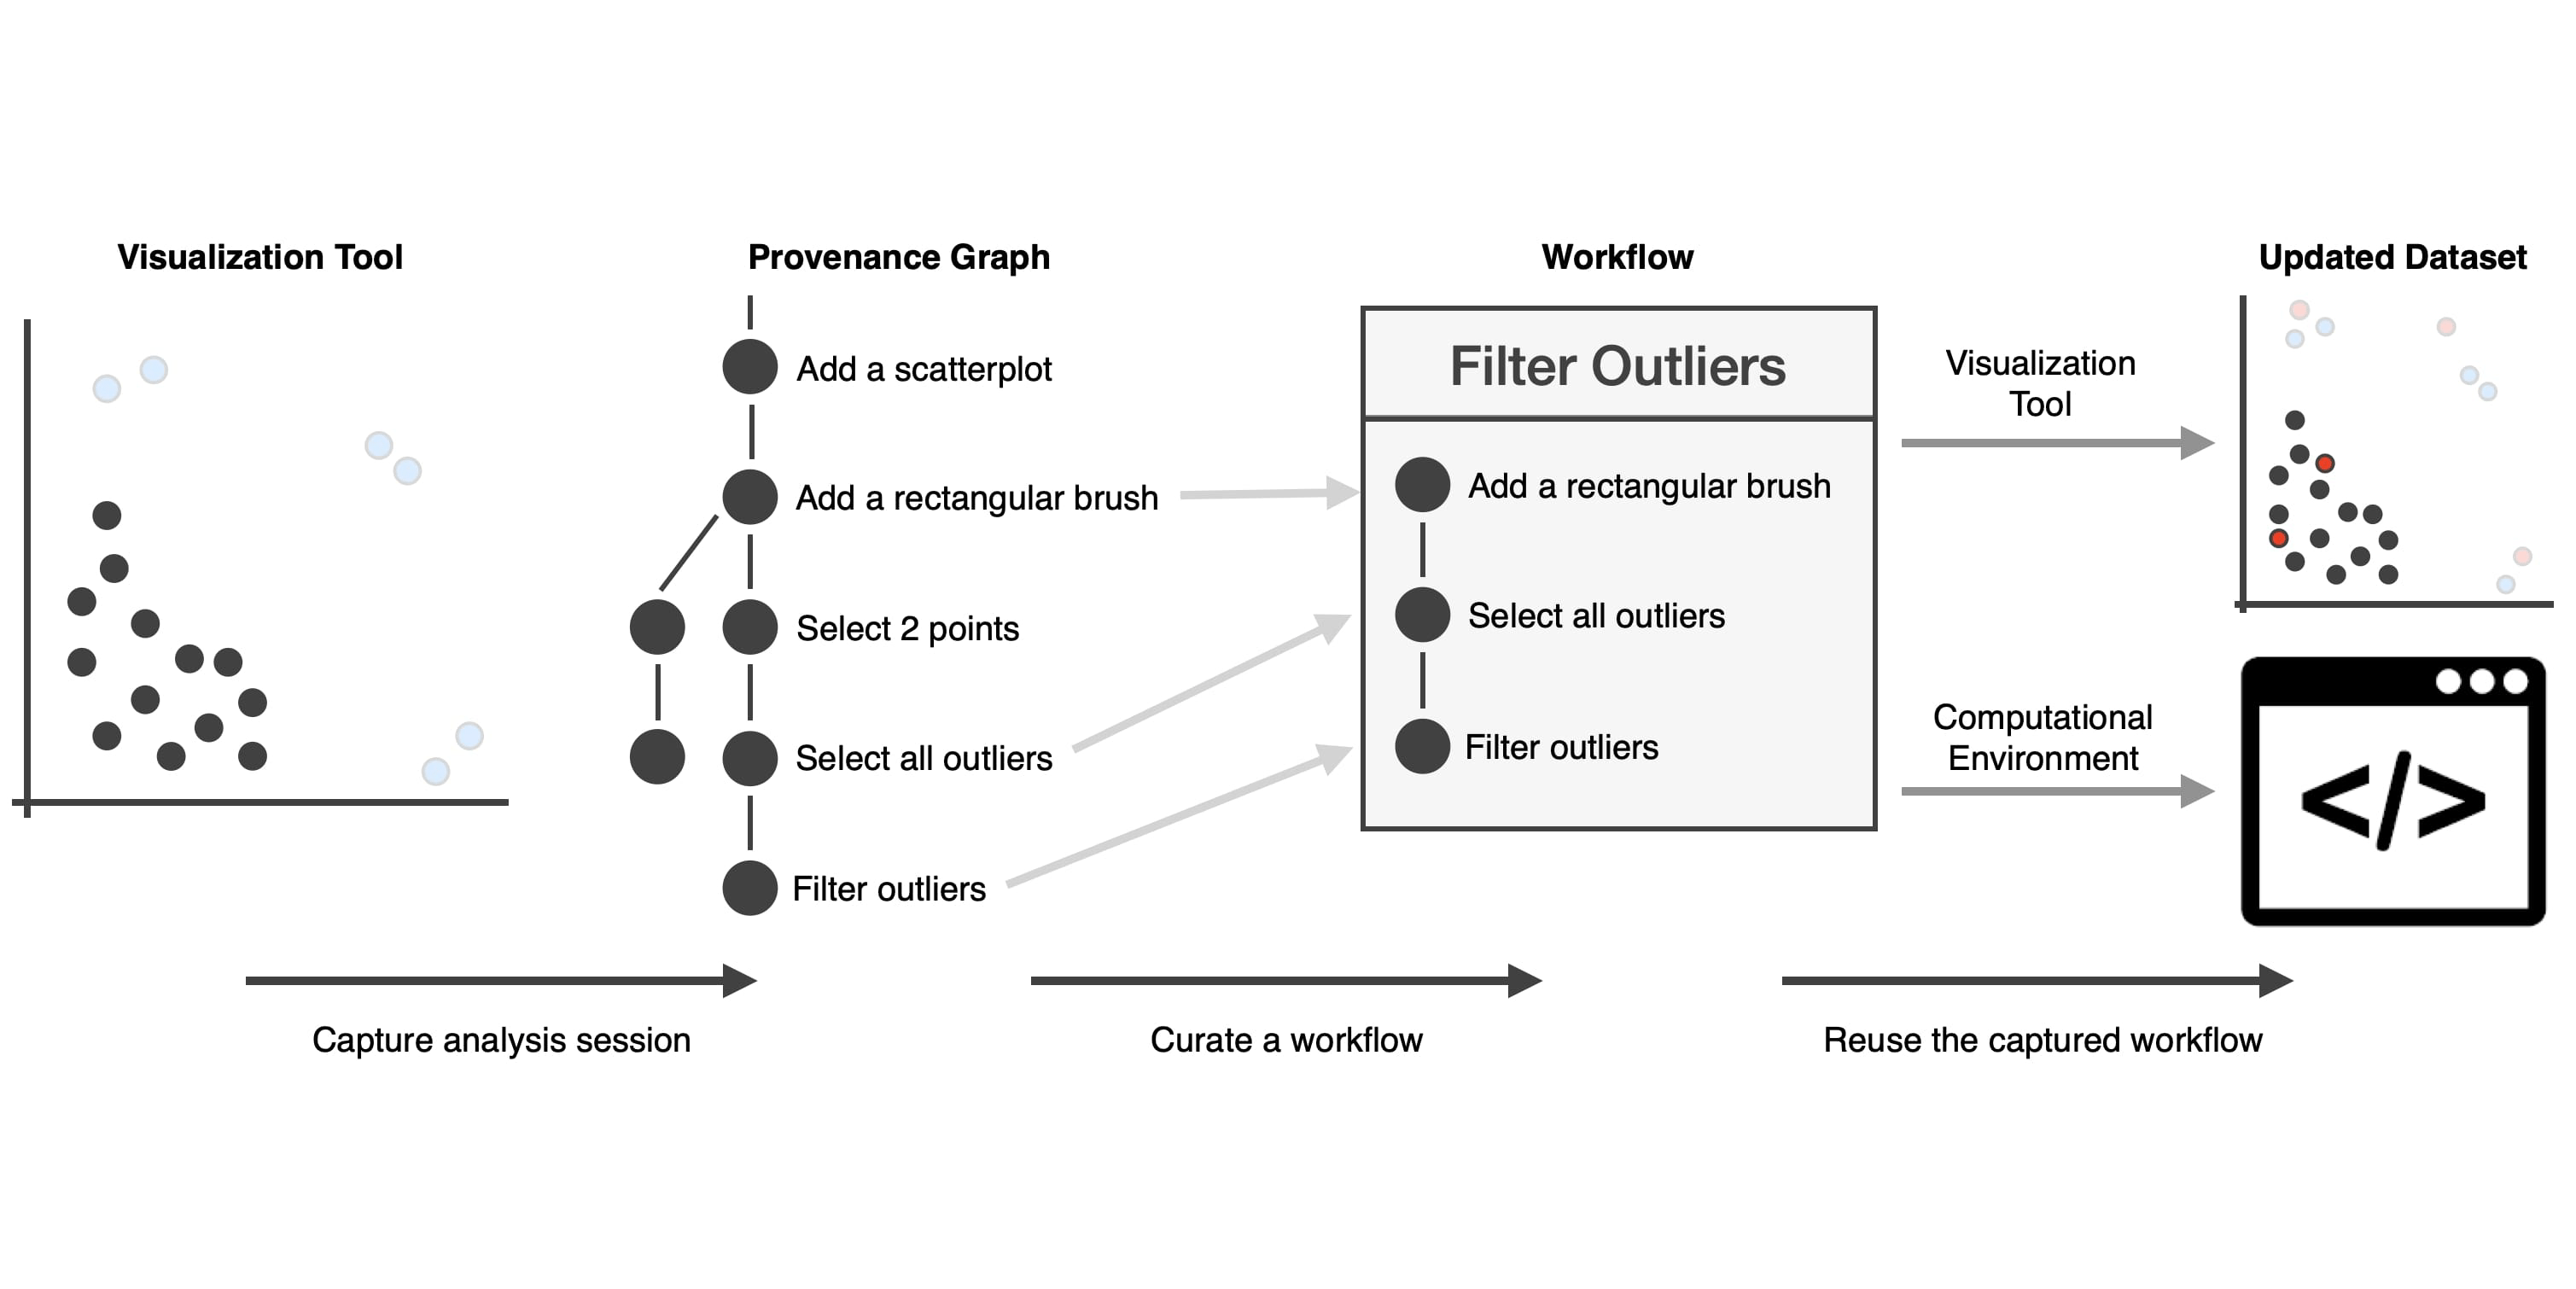
Abstract: In visualization, provenance is widely used for action recovery, to document analysis processes, and to analyze user behavior. In this talk, however, I will focus on an exciting application of provenance: to bridge between code-based and interactive and visual data analysis. Code-based and interactive data analysis have different strengths and weaknesses. Some operations can be more easily executed in one than in the other. Interactive visualization tends to be more "natural" and easier to understand, but code-based analysis is typically more reproducible. While traditionally these two approaches can't be easily combined, I'll show how we can leverage provenance data to tackle these issues and design a truly integrated analysis environment.
Abstract: In visualization, provenance is widely used for action recovery, to document analysis processes, and to analyze user behavior. In this talk, however, I will focus on an exciting application of provenance: to bridge between code-based and interactive and visual data analysis. Code-based and interactive data analysis have different strengths and weaknesses. Some operations can be more easily executed in one than in the other. Interactive visualization tends to be more "natural" and easier to understand, but code-based analysis is typically more reproducible. While traditionally these two approaches can't be easily combined, I'll show how we can leverage provenance data to tackle these issues and design a truly integrated analysis environment.
Celebrating 30 Years of ICG, Graz University of Technology, Graz, Austria, 2023-06-12
Abstract: Spatial omics analysis poses great challenges for data visualization as large data vectors are collected on dense, spatially located biological entities. However, there are parallels to other data types where location or topology are imperative: maps and networks. I will give an overview of the challenges encountered when analyzing spatial omics data, and highlight parallels and differences to maps and networks. I will then speculate on how visualization techniques for maps and networks could be leveraged for spatial omics data.
BioVis@VIS, IEEE VIS, New Orleans, USA (virtual), 2021-10-25.
Abstract: Most logging approaches record system events at a fairly low level of abstraction. In this talk, I will argue that higher levels of abstraction are possible and desirable. I will highlight opportunities for increasing semantics that software developers have by carefully recording meaningful events. I will then show that we can leverage algorithmic methods to infer user-intents. Finally, I will show opportunities for eliciting key information from insights directly from users. Explicitly asking users about their intentions has benefits for users, as they can later retrace their steps more efficiently, and system developers, as they can learn more about usage patterns of their system and motivations of their users. There are diverse user input modalities that can provide information at different levels of abstraction and invasiveness. These modalities range from multiple choice responses, to structured notes, to “think-aloud-like” approaches. In combination, these approaches are promising for building systems that have a better understanding of their users and hence can support users in their analytical tasks.
May Institute, Computation and statistics for mass spectrometry and proteomics, Northeastern University, Boston, MA, USA, 2019-05-06.
Invited Talks
Abstract: Interactive data visualization is central to modern data science, particularly within the life sciences. It enables researchers to directly engage with their data, quickly explore hypotheses, and uncover patterns with minimal friction. Visualization solutions range from highly specialized tools designed for specific biological challenges to flexible, general-purpose libraries used across domains.
In this talk, I will present two examples at opposite ends of this spectrum. The first is a bespoke, domain-specific visualization system developed to address the complex task of analyzing live-cell microscopy data. The second demonstrates how interactive visualizations can be seamlessly integrated with Python code in Jupyter Notebooks, creating a powerful environment for exploratory analysis. Together, these examples highlight both the current landscape and future potential of visualization in biological data science.
BioTechMed Science Breakfast, Graz, Austria, 2026-02-11.
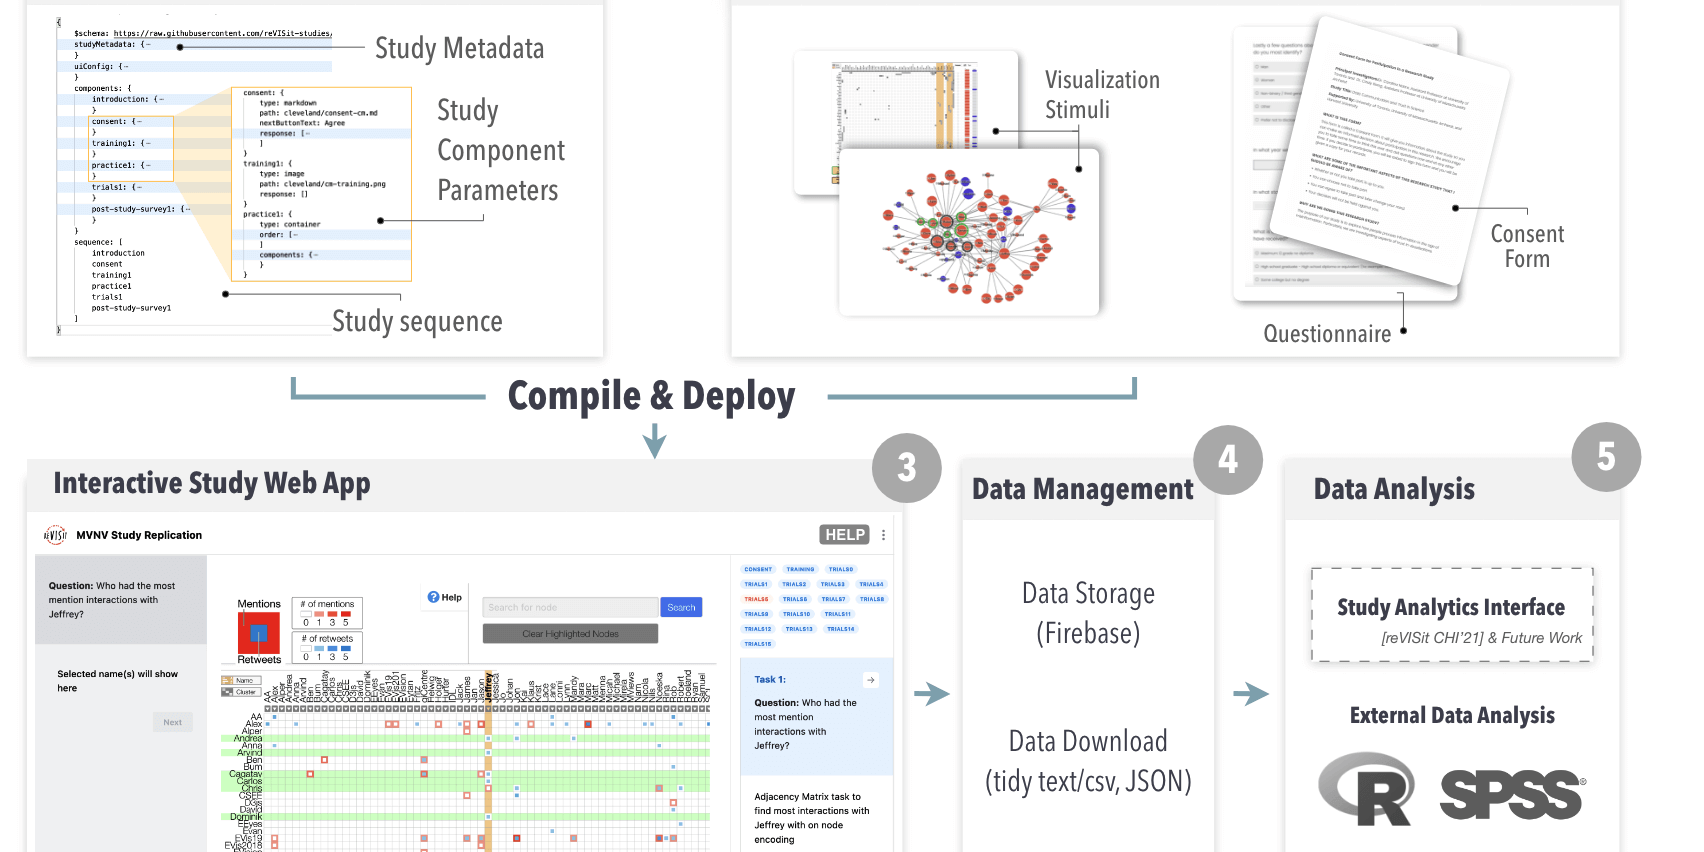
Abstract: In this talk we introduce the reVISit framework for designing and running empirical studies online. Traditional survey tools limit the flexibility and reproducibility of online experiments. To remedy this, we introduce a domain-specific language, the reVISit Spec, that researchers can use to design complex online user studies. reVISit Spec, combined with the relevant stimuli, is compiled into a ready-to-deploy website that handles all aspects of a user study, including sophisticated provenance-based data tracking, randomization, etc. reVISit is a community focused project and ready to use! Visit https://revisit.dev/ to get started.
Georgia Tech, Atlanta, GA, USA 2025-01-13.
Abstract: In this talk I introduce the reVISit framework for designing and running empirical studies online. Traditional survey tools limit the flexibility and reproducibility of online experiments. To remedy this, we introduce a domain-specific language, the reVISit Spec, that researchers can use to design complex online user studies. reVISit Spec, combined with the relevant stimuli, is compiled into a ready-to-deploy website that handles all aspects of a user study, including sophisticated provenance-based data tracking, randomization, etc. reVISit is a community focused project and ready to use! Visit https://revisit.dev/ to get started.
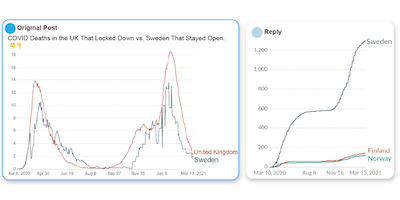
I will then pivot to talk about data-driven misinformation in the form of charts shared on social networks. I will demonstrate that “lying with charts” doesn’t work the way we (used to) think about it, and introduce a few strategies to “protect” charts and charting tools from being abused by malicious users. I will connect back to reVISit by illustrating how we leveraged it to run a series of crowd-sourced experiments.
MIT CSAIL HCI Seminar, Cambridge, MA, USA 2024-12-13.
Abstract: In this talk I want to introduce three not particularly related research topics: provenance, user studies, and visualization-based misinformation.
In visualization, provenance is widely used for action recovery, to document analysis processes, and to analyze user behavior. I will focus on an exciting new application of provenance: to bridge between code-based and interactive, visual data analysis. While traditionally these two approaches can’t be easily combined, I’ll show how we can leverage provenance data to tackle these issues and design a truly integrated analysis environment.
Next, I will introduce the reVISit framework for designing and running empirical studies online. Traditional survey tools limit the flexibility and reproducibility of online experiments. To remedy this, we introduce a domain-specific language, the reVISit Spec, that researchers can use to design complex online user studies. reVISit Spec, combined with the relevant stimuli, is compiled into a ready-to-deploy website that handles all aspects of a user study, including sophisticated provenance-based data tracking, randomization, etc. reVISit is a community focused project and ready to use! Visit https://revisit.dev/ to get started.
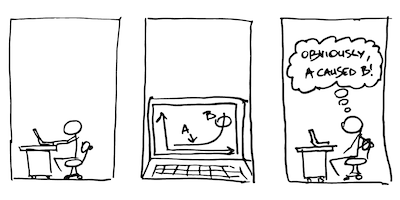
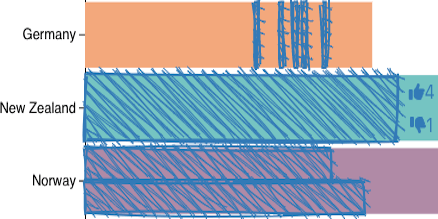
Finally, I will talk about data-driven misinformation in the form of charts shared on social networks. I will demonstrate that “lying with charts” doesn’t work the way we (used to) think about it, and introduce a few strategies to “protect” charts and charting tools from being abused by malicious users.
I will conclude by discussing how these topics mesh together after all, as (a) each project benefits from developments in the others, and (b) they all are enabled by my approach of combining engineering with visualization research.
Department of Informatics Colloquium, University of Zürich, Zürich, Switzerland, 2024-10-03.
Media and Information Technology (MIT) Seminar, Linköping University, Norrköping, Sweden, 2024-06-03.
Oncological Data Science Symposium, ODSi, Huntsman Cancer Institute, Utah, 2023-02-28
Abstract: Traditional empirical user studies tend to focus on testing aspects of visualizations or perceptual effects that can be fully controlled. Evaluating or comparing complex interactive visualization techniques, in contrast, is much more difficult, as complexity increases confounders. This challenge is aggravated when using crowdsourcing for evaluation, as crowd participants tend to be novices with limited motivation for excelling at a task. In this talk I will introduce methods to run and analyze such studies for complex visualization techniques, including procedural suggestions for crowdsourced studies, design of stimuli for testing, instrumentation of stimuli, and analysis of user behavior based on the data collected.
SCI VIS Seminar, University of Utah, USA, 2022-08-31.
Institute for Computer Graphics, TU Wien, Vienna, Austria, 2022-06-03.
Abstract: Interactive visualization is an important part of the data science process. It enables analysts to directly interact with the data, exploring it with minimal effort. Unlike code, however, an interactive visualization session is ephemeral and can't be easily shared, revisited, or reused. Computational notebooks, such as Jupyter Notebooks, R Markdown, or Observable are widely used in data science. These notebooks are an embodiment of Knuth's “Literate Programming”, where the logic of a program is explained in natural language, figures, and equations. As a consequence, they are both reproducible, and reusable. In this talk, I will sketch approaches to “Literate Visualization”. I will show how we can leverage provenance data of an analysis session to create well-documented and annotated visualization stories that enable reproducibility and sharing. I will also introduce work on inferring analysis goals, which allows us to understand the analysis process at a higher level. Understanding analysis goals enables us to enhance interaction capabilities and even re-used visual analysis processes. I will conclude by demonstrating how this provenance data can be leveraged to bridge between computational and interactive environments.
Visualization Summer School of Zhejiang University, China (virtual), 2022-07-07.
VRVis Zentrum für Virtual Reality und Visualisierung, Vienna, Austria, 2022-03-24.
Graz University of Technology, Graz, Austria, 2021-11-11.
Séminaire LIRIS, CNRS / INSA Lyon / Université Lyon 1 & 2 / École Centrale de Lyon, Lyon, France, 2021-10-18.
Visualization of Biological Data - From Analysis to Communication, Dagstuhl Seminar, Schloss Dagstuhl, Germany, 2021-10-04.
Datavisyn Public Lecture Series, datavisyn, Linz, Austria, 2021-07-02.
ICG Lab Talk, Johannes Kepler University, Linz, Austria, 2021-06-15.
Departmental Seminar, Department of Computer Science, City University London, London, UK (virtual), 2020-11-17.
Goldman Sachs Tech Expo, Salt Lake City, UT, USA, 2020-07-24.
Utah Center for Data Science Seminar, Salt Lake City, UT, USA, 2020-01-06.
Abstract: Spatial omics analysis poses great challenges for data visualization as large data vectors are collected on dense, spatially located biological entities. However, there are parallels to other data types where location or topology are imperative: maps and networks. I will give an overview of the challenges encountered when analyzing spatial omics data, and highlight parallels and differences to maps and networks. I will then speculate on how visualization techniques for maps and networks could be leveraged for spatial omics data.
Worcester Polytechnic Institute, BCB Seminar Series, 2021-12-09.
Abstract: Today, scientific discovery is increasingly data-driven and enabled by computational tools. However, there are many aspects of the data science process for which purely automatic approaches do not suffice. In a typical data analysis scenario, reasoning and incorporating contextual knowledge is essential, and when decisions are ultimately made by humans, they need to be knowledgeable about the data and the methods applied. In my talk I will show how to enable this interplay between data, computation, visualization, and humans to augment intelligence. My work usually falls into one of three categories (I) technical contributions, (II) domain-driven techniques, and (III) empirical/theoretical work.
As an example for a technical contribution, I will introduce my vision for “Literate Visualization”, an analogy to Knuth’s “Literate Programming”, which is widely used in the form of computational notebooks in data science today. We can leverage provenance data of an analysis session to create well-documented and annotated visualization stories that enable reproducibility and sharing. By semi-automatically inferring analyst's intents for operations such as brushing, aggregating, filtering, etc., we can improve reproducibility and enable reusability, which in turn also allows us to seamlessly bridge between interactive workflows and computational workflows.
To showcase my domain-driven work, I will describe a technique we developed to analyze large clinical genealogies with the purpose of identifying suicide cases that have a likely genetic component.
Department of Computer Science, University of Copenhagen, Denmark, 2021-10-04
Institute for Science and Technology (IST) Austria, Klosterneuburg, Austria, 2020-02-25.
NIH-NCI Workshop on Accelerating Cancer Research through User-Centered Software Design, Washington, DC, USA, 2019-01-07.
Adobe, Lehi, UT, USA, 2019-04-10.
Lucid Software, Salt Lake City, UT, USA, 2019-03-12.
Goldman Sachs Tech Expo, Salt Lake City, UT, USA, 2017-06-28.
Department Of Biomedical Informatics, University of Utah, Salt Lake City, UT, USA, 2017-04-06.
Walmart, Tech Tuesday, Bentonville, AK, USA, 2017-02-07.
Marth Lab, Department of Human Genetics, University of Utah, Salt Lake City, UT, USA, 2016-08-25.
Pacific Northwest National Laboratory, Richland, WA, USA, 2016-07-01.
Huntsman Cancer Institute, Salt Lake City, UT, USA, 2016-03-30.
Camp Lab, Huntsman Cancer Institute, University of Utah, Salt Lake City, UT, USA, 2015-11-23.
Abstract: When visualizing multivariate networks we commonly have to make trade-offs between optimizing for the readability of a network's topology and the attributes associated with its nodes and or edges. In this talk I will first introduce the design space of multivariate network visualization, and then go into details about one strategy: layout adaption. I will give examples that demonstrate that different layout adaption strategies occupy a sweet-spot on the continuum between layouts optimized for attributes and topology. I will show examples for general purpose networks, such as co-author networks and for special graph types such as tree-like genealogies.
University of Calgary, Calgary, AB, Canada, 2018-06-18.
Abstract: The majority of diseases that are a significant challenge for public and individual heath are caused by a combination of hereditary and environmental factors. The Utah Population Database is a unique resource to study these multifactorial diseases. Incorporating familial relationships between cases with other data can provide insights into shared genomic variants and shared environmental exposures that may be implicated in such diseases. The analysis of this data, however, is challenging. In this talk, we will introduce Lineage, a novel visual analysis tool designed to support domain experts who study psychiatric multifactorial diseases with UPDB data.
NIH-NCI Workshop on Accelerating Cancer Research through User-Centered Software Design, Washington, DC, USA, 2019-01-07.
Genome Rounds, University of Utah, SLC, UT, USA, 2018-08-24.
Department of Psychiatry, University of Utah, SLC, UT, USA, 2018-06-05.
BioIT World Conference & Expo, Boston, MA, USA, 2018-05-17.
Harvard John A. Paulson School of Engineering and Applied Sciences, Harvard University, Cambridge, MA, USA, 2018-05-16.
Helmholtz Diabetes Center, Munich, Germany, 2018-10-29.
Translational Genomics Research Institute (TGen), Phoenix, AZ, USA, 2018-08-14.
Association for Molecular Pathology (AMP) Annual Meeting, Salt Lake City, UT, USA, 2017-11-17.
Merck Research Laboratories, Boston, MA, USA, 2017-06-15.
Department Of Biomedical Informatics, Harvard Medical School, Boston, MA, USA, 2017-06-14.
University of Vienna, Vienna, Austria, 2015-08-07.
Adobe Research, San Francisco, CA, USA, 2015-04-06.
EPFL, Lausanne, Switzerland, 2015-03-26.
University of Utah, Salt Lake City, UT, USA, 2014-12-03.
University of St. Andrews, St. Andrews, Scotland, 2014-11-03.
Data Ventures, Harvard University, Cambridge, MA, USA, 2015-04-23.
BioIT World Conference & Expo, Boston, MA, USA, 2015-04-22.
Tufts University, Sommerville, MA, USA, 2014-10-29.
PerkinElmer, Boston, MA, USA, 2014-11-05.
Novartis Institutes for BioMedical Research, Cambridge, MA, USA, 2014-07-09.
Drug Discovery on Target Conference, Boston, MA, USA, 2014-10-08.
BioIT World Conference & Expo, Boston, MA, USA, 2014-05-01.
DBMI, Harvard Medical School, Boston, MA, USA, 2014-04-17.
Georgia Tech, School of Interactive Computing, Atlanta, GA, USA, 2014-04-08.
University of Calgary, Department of Computer Science, Calgary, AB, Canada, 2014-02-13.
MIT CSAIL, Cambridge, MA, USA. 2013-04-12.
UMass Lowell, Lowell, MA, USA, 2013-11-06.
Harvard Graduate School of Education, Strategic Data Project, Cambridge, MA, USA, 2014-03-07.
Novartis Institutes for BioMedical Research, Cambridge, MA, USA, 2013-07-29.
BioIT World Conference & Expo, Boston, MA, USA, 2013-04-10.
Visualizing Biological Data (VIZBI) 2013, Cambridge, MA, USA, 2013-03-20.
Symposium on Understanding Cancer Genomics through Information Visualization at Tokyo University, Tokyo, Japan, 2013-02-22.
CBMI, Harvard Medical School, Boston, MA, USA, 2011-08-12.
MRC Laboratory of Molecular Biology (LMB), Cambridge, UK, 2010-09-21.
European BioInformatics Institute (EBI), Cambridge, UK, 2010-09-20.
VCBM 2010 Leipzig, Germany, 2010-07-02.
VRVis Research Company, Vienna, Austria. 2010-03-11.
AUVA Research Center for Traumatology, Vienna, Austria, 2009-02-26.
Institute for Genomics and Bioinformatics, Graz University of Technology, Austria, 2008-07-10.
Paper Presentations
Abstract: In visualization, provenance is widely used for action recovery, to document analysis processes, and to analyze user behavior. In this talk, however, I will focus on an exciting application of provenance: to bridge between code-based and interactive and visual data analysis. Code-based and interactive data analysis have different strengths and weaknesses. Some operations can be more easily executed in one than in the other. Interactive visualization tends to be more "natural" and easier to understand, but code-based analysis is typically more reproducible. While traditionally these two approaches can't be easily combined, I'll show how we can leverage provenance data to tackle these issues and design a truly integrated analysis environment.
EuroVis Conference, Odense, Denmark, 2024-05-29
BioVis @ ISMB, Orlando, FL, USA, 2016-07-08.
IEEE InfoVis, Paris, France, 2014-11-03.
IEEE BioVis 2012, Seattle, Washington, USA, 2012-10-14.
EuroVis 2012, Vienna, Austria, 2012-06-07.
IEEE InfoVis 2011, Providence, Rhode Island, USA, 2011-10-26.
Information Visualization 2011, London, UK. 2011-07-14.
IEEE InfoVis 2010, Salt Lake City, Utah, USA. Paper presentation, 2010-10-28.
PacificVis 2010, Taipei, Taiwan. 2010-03-03.
Tutorials
Held by together with members of the reVISit team.
Abstract: There are currently two main approaches for running online user studies: experimenters can use commercial survey tools, which are easy to use but can be costly, hamper reproducibility, and have limitations for complex stimuli; or they can build custom software to run and instrument a study, which is a laborious and complex task. In this tutorial, we introduce participants to a new, open-source alternative: the reVISit study platform. Many studies quickly reach a burdensome level of complexity, necessitating design of stimuli and experimental tasks as well as the study UI, data hosting, participant recruiting, randomization, etc. ReVISit ameliorates these problems and allows study designers to focus more on the research questions and stimulus design. ReVISit removes the tedium of study design by providing built-in components that most studies will need. ReVISit provides a domain-specific language and a notebook-oriented library that enables study designers to quickly create studies and deploy them as publicly accessible websites. This tutorial will introduce reVISit to the visualization community and allow community members to get hands-on experience with it through a series of practical examples. Participants will improve on a study until they have developed and deployed a study of an interactive, fully instrumented data visualization.
IEEE VIS 2026, Boston, USA, November 2026
EuroVis 2026, Nottingham, England, June 2026
GI Center, City University of London and University of Warwick, (virtual), May 2026
TU Wien, Austria (virtual), March 2026
IEEE VIS 2025, Vienna, November 2025
EuroVis 2025, Luxembourg, June 2025
CHI 2025, Japan, April 2025
UNC Chapel Hill, March 12, 2025
University of Utah, February 5, 2025
Georgia Tech, January 2025
IEEE VIS, October 2024, Florida, USA.
Carolina Nobre, Marc Streit, and Alexander Lex
Companion Website
IEEE VIS 2019, Vancouver, BC, Canada, 2019-10-20.
Nils Gehlenborg and Alexander Lex
Alexander Lex and Marc Streit
Symposium on Understanding Cancer Genomics through Information Visualization, Tokyo University, Tokyo, Japan, 2013-02-22.
Marc Streit, Hans-Jörg Schulz, and Alexander Lex
Handout & References
VisWee, Seattle, WA, USA, 2012-10.
Panels
Teaching
Current PhD Students
Zach Cutler
| Visualization tools, Provenance, Storytelling
Khandaker Abrar Nadib
| Human Centered Computing, Visualization, Applied Data Science
Graduated PhD Students
Maxim Lisnic, PhD '25
Devin Lange, PhD '24
Kiran Gadhave, PhD '24
Haihan Lin, PhD '23, Now at Lucid Software
Jen Rogers, PhD '22, Now PostDoc at Tufts University
Carolina Nobre, PhD '20, Now Faculty at the University of Toronto
Christian Partl, PhD '18 (co-advised with Dieter Schmalstieg)
Former Students
Zoe Exelbert, BS '25
Luke Schreiber
| Data Visualization, Health Science
Ishrat Jahan Eliza
Sunny Siu, BS/MS '21
Shaurya Sahai, MS '21
Zach Cutler
| Visualization tools, Provenance, Storytelling
Pranav Rajan, B.S.'21
Hannah Bruns, BS '20
Max Marno, PhD rotation '20
Ilkin Safarli
Sai Varun, MS '20
Dylan Wootton, BS '19, Now PhD student at MIT
Shuvrajit Mukherjee
T Cameron Waller
Pranav Dommata, MS '18
Sahar Mehrpour, PhD rotation '17
Mengjiao Han, PhD rotation '17
Asmaa Aljuhani, PhD rotation '17
Annie Cherkaev, PhD rotation '17
Sunny Hardasani, MS '16
Anirudh Narasimhamurthy, MS '16
Michael Kern, MS '16
Murali Krishna Teja Kilari, MS '17
Sateesh Tata, MS '16
Roy Bastien, BS '16
Priyanka Parekh, BS '16
Shreya Singh, MS '15
Varsha Alangar, MS '15
Rasvan Iliescu, MS '14
Alain Ibrahim, MS '14
Tamar Rucham, MS '14
Gabriel Hase, MS '14
Conor Myhrvold, MS '14
Ran Sofia Hou, BS '13 (co-advised with Joe Blitzstein)
Thomas Geymayer, MS '12, BS '11 (with D. Schmalstieg)
Christian Partl, MS '12 (with D. Schmalstieg)
Michael Lafer, BS '10 (with D. Schmalstieg)
Hannes Plank, BS '11 (with D. Schmalstieg)
Jürgen Pillhofer, MS '10 (with D. Schmalstieg)
Michael Wittmayer, BS '09 (with D. Schmalstieg)
Helmut Pichlhöfer, BS '10 (with D. Schmalstieg)
Oliver Pimas, BS '10 (with D. Schmalstieg)
Bernhard Schlegl, MS '09 (with D. Schmalstieg)
Werner Puff, MS '10 (with D. Schmalstieg)
Christian Partl, BS '09 (with D. Schmalstieg)
Stefan Sauer, BS '09 (with D. Schmalstieg)
Courses
Applied Data Visualization | COMP 5960
Fall 2023, Fall 2024
https://www.dataviscourse.net/2023-applied/
Professional Development | CS 4011
Spring 2024
Human Centered Data Analysis | CS 6957
Spring 2023
Visualization for Data Science | CS 5630 / CS 6630
Fall 2022, Fall 2020, Fall 2019, Fall 2018, Fall 2017, Fall 2016, Fall 2015
http://dataviscourse.net
Introduction to Data Science | COMP 5360 / MATH 4100
Spring 2018, Spring 2019, Spring 2020, Spring 2021
http://datasciencecourse.net
Co-Instructor: Braxton Osting
Introduction to Data Science | CS 5963 / MATH 3900
Fall 2016
http://datasciencecourse.net
Co-Instructor: Braxton Osting
Visualization Seminar | CS 7942
Spring 2018, Fall 2017, Spring 2017, Fall 2016
Visualization | CS 171 (Harvard)
Spring 2015
http://www.cs171.org/2015/
BioVis | (JKU Linz)
Spring 2013
Selected Topics Computer Graphics | (TU Graz)
Fall 2010, Fall 2011, Fall 2012
Press
TU Graz News, 2025
Alexander Lex: How can data be communicated more effectively?
SCI Insitute & @TheU, 2024
NSF-Funded Team Launches reVISit – Pioneering Open-Source Software for Visualization Research
Inside Science, 2017
How Math Can Help Geologists Discover New Minerals
The OpenHelix Blog, 2016
Video Tip of the Week: Pathfinder, for exploring paths through data sets
The OpenHelix Blog, 2014
Video Tip of the Week: UpSet about genomics Venn Diagrams?
The Harvard Crimson, 2014
Painting by the Numbers: Data Visualization
The Harvard Crimson, 2014
New Tool Makes Cancer Analysis More Accessible
Harvard Medical School News, 2014
Pattern Recognition: New visualization software uncovers cancer subtypes
GenomeWeb, 2014
Harvard TCGA Data Visualization Software Adds Tools to Better Characterize Disease Subtypes
The OpenHelix Blog, 2014
StratomeX for genomic stratification of diseases
Harvard SEAS News & Harvard Gazette, 2014
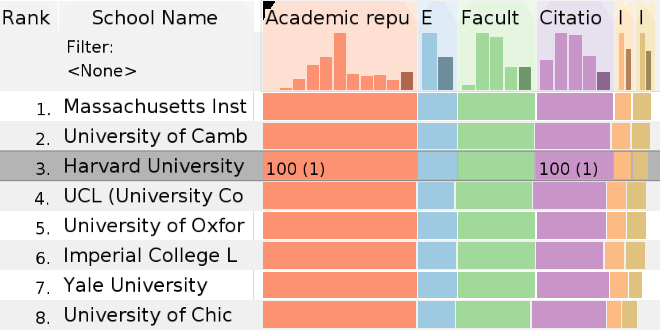
What's behind a #1 ranking?
Forbes, 2014
Harvard And DARPA Develop Software For Deconstructing Top 100 Rankings
Der Standard, 2014
Heimische Forscher machen die Dynamik hinter Rankings sichtbar
The OpenHelix Blog, 2014
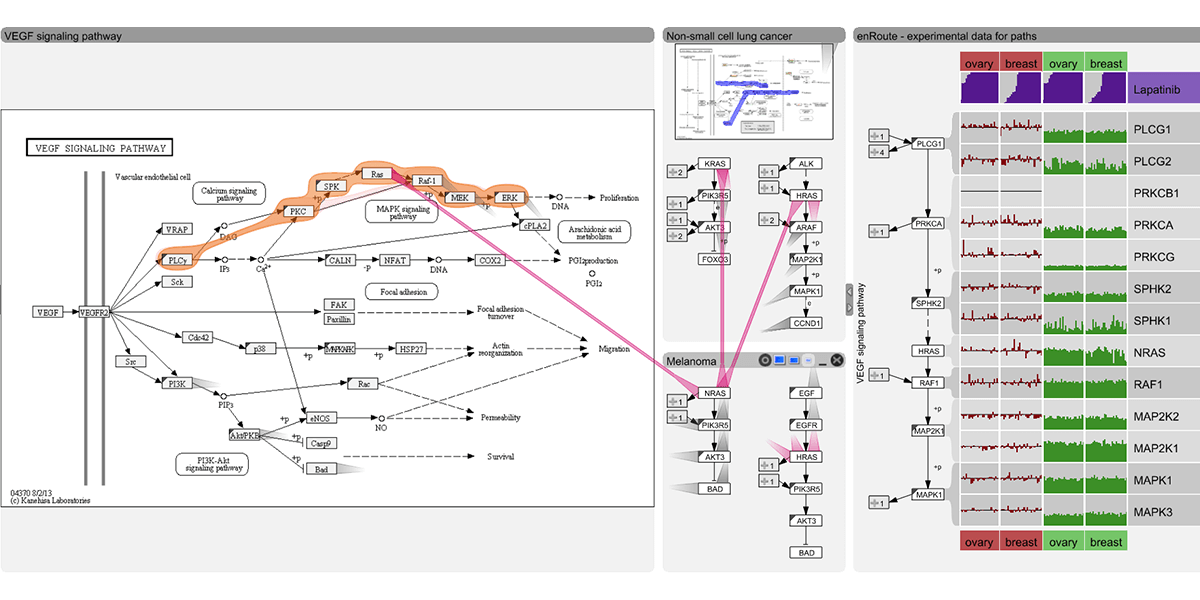
Video Tip of the Week: Entourage and enRoute from the Caleydo team
Nature Methods, 2013
Data visualization: ambiguity as a fellow traveler
GEN - Genetic Engineering & Biotechnology News, 2013
Pathway Analysis to Decipher Data
Harvard SEAS News, 2013
Celebrating minds dedicated to discovery
The OpenHelix Blog, 2010
Tip of the Week: Caleydo for gene expression and pathway visualization