Abstract
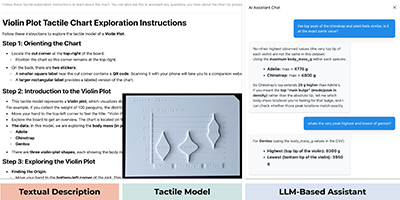
Visualizations are central to communicating data, yet blind and low-vision (BLV) people often lack support for understanding chart types---knowledge that is essential for interpreting new visualizations and collaborating with sighted peers. Prior work found that BLV individuals viewed example tactile charts as more helpful than text-only approaches and preferred them for learning advanced chart types, particularly for understanding spatial layouts and shapes. Meanwhile, large language models (LLMs) are increasingly used by BLV individuals for chart explanation and question answering (QA), but have been studied primarily for dataset exploration rather than chart-type learning. Existing LLM-based chart QA also shows that users frequently ask about layout and structure, yet struggle with spatial concepts and misdirect questions when mental models are weak. We investigate how LLMs influence chart-type learning and whether tactile learning improves subsequent LLM-supported exploration. We extend our tactile chart learning tools with an LLM chatbot that provides interactive explanations and supports follow-up questions. In an interview study with 12 BLV participants, we compare two learning formats: (1) a tactile chart, a textual explanation, and an LLM chatbot; and (2) a textual explanation and an LLM chatbot. The learning phase was followed by exploration of an unfamiliar dataset using alt text and an LLM. Thematic analysis shows that tactile templates support BLV participants' formation of chart-type mental models, which scaffolds subsequent LLM-mediated data exploration. Text+LLM explanations without tactile support show weaknesses for spatial-reasoning tasks.Citation
Tingying He,
Maggie McCracken,
Daniel Hajas,
Sarah Creem-Regehr,
Alexander Lex
Touching or Chatting: The Utility of LLMs and Tactile Charts for Learning about Complex Chart Types by BLV Individuals
IEEE Transactions on Visualization and Computer Graphics (VIS), 2027.
BibTeX
@article{2026_vis_tactile-llm,
  title = {Touching or Chatting: The Utility of LLMs and Tactile Charts for Learning about Complex Chart Types by BLV Individuals},
  author = {Tingying He and Maggie McCracken and Daniel Hajas and Sarah Creem-Regehr and Alexander Lex},
  journal = {IEEE Transactions on Visualization and Computer Graphics (VIS)},
  year = {2027}
}
Acknowledgements
The authors thank Aaron Delahunta and Sofia Djunic for correcting interview transcripts.